Entropy and fraud analytics

Snip20160807_1

When I was studying Physics at University, I deeply fell in love with one “quantity” or “concept”: that of the ENTROPY of a system.

Perhaps you have not heard of it, but it is so important that in some ways it relates to:

  1. Time itself
  2. Disorder
  3. Information
  4. Energy
  5. Optimisation
  6. Economics and much more…

I find it incredibly interesting that the time evolution of the universe in a direction (universe from the Latin means one direction…please do not think of the boy band!) rather than another, is still a fundamentally unknown property of reality. In fact it appears that systems processing information (like us), wouldn’t perceive time if it weren’t for a particular tendency of Entropy to increase (also, we would be immortal too!).

Closing the Physics parenthesis, in the context of this blog post, I can tell you that I will see Entropy as a measure of “disorder”, and also as a measure of “information” contained in “something”.

To be more explicit, I see something possessing a high level of disorder if, by changing it slightly, it doesn’t change the way I see it. For example, if your desk is a mess (high disorder), I can move some paper from the left to the right, and I still basically see a messy desk. If your desk is tidy (low disorder) and I put a t-shirt on it… I easily perceive that something isn’t as it should.

Also, when I refer to the information possessed by something I mean pretty much the number of “meaningful” answers to straight yes/no questions that something can give me. Here “meaningful” is not defined but I hope you can follow.

What does this have to do with fraud analytics?

Let me put it this way asking you a couple of questions:

  1. Do you think that when a certain system (you could think of a payment processor infrastructure, or a trading desk) is being cheated, will the system be more or less tidy?
  2. Do you think that the information of a system where fraud happens is larger or smaller than a normal system?

When fraudster do act, they do not act randomly, they act on purpose and follow patterns, therefore your system could show signs of being “more tidy” than usual. For example, processing several hundreds payments of the same amount, or seeing traders all following a particular investment strategy (perhaps suggesting insider trading?) might not be a natural state of affairs.

When you see something following a pattern, you instinctively think that there is SOMEONE behind it… in other words it cannot be random. This is equivalent to say that Entropy tend to be high, unless we work to make it low (e.g. sorting out your desk).

This is when Entropy can come in and help fraud analysts monitor the system and see if too many patterns are emerging.

It can get even more interesting since we can also calculate the Entropy of X given Y. Therefore we can also analyze relationships with all the weaponry that statisticians can use to establish relationships.

Let’s look at some numbers.

Here’s a vector of random numbers: 52  31  22  52 100  46  11  24  77  21

Here’s a vector of not so random numbers: 10  10  10  20  20  20  30  30  30 100 

Using R (the statistical computing language), for example, we can calculate the Entropy of the random collection of numbers. We get 2.16 (don’t care about the units for now).

If we calculate the Entropy of the not so random vector we get 1.3.

But let’s now add some additional information and context. Let’s consider the vector of not so random numbers as the amount that was withdrawn on certain days. Let’s also look at the days: Mon, Tue, Wed, Tue, Wed, Thu, Thu, Fri, Sat, Sun.

Now what’s the Entropy of those cash withdrawals given the days they were made?

o,4

That tells us that this is a pattern, not necessarily a fraudulent one, but if we have a hypothesis over the average Entropy of cash withdrawals we could somewhat understand if a Bot/Fraudster has brought order where there shouldn’t be!

Overall, thinking of utilising Entropy in any analytics related matter is a fascinating example of the variety of tools, and sources of inspiration, that can help data professionals (and data driven organisations) in achieving their objectives.


Hidden signals and value based model evaluation

HMM4

Perhaps you might know that I am rather interested in “latent variables” that is: hidden signals.

Why is that?

Let me put it simply. 99% of statistics is about doing one thing very well: distinguishing signals from noises.

You want to know if that stock price is fluctuating in a worrying way?

You need to check whether those fluctuations are statistically common (noise) or if we see something “unlikely” or unprecedented (signal).

Also, generally, you’d like to test how confident you are in distinguishing signal from noise (but a lot of people don’t actually do this).

The beauty of latent variables, and, in particular, of Hidden Markov Models (HMM) is that you are actually trying to discover a “secret” signal.

The secret signal could be a fundamental signal underlying a phenomena, or even data that actually explains the relationship between two different processes.

This is something that opens a world of possibilities.

Let me give you an example, a very simple one.

An individual uses his/her credit card every now and then, but more so towards the end of the month and, generally, for restaurants and entertainment.

Now, this individual finds a second half, and he/she starts using the same card since the card comes with discounts and points.

The signal changes completely, and, if the credit card issuer does any analytics, it might believe that the particular customers is spending more (great!) and they have gained share of wallet (great again).

On the other hand there is only one account owner and now all those card linked offers are all over the place!

Here there is a missed opportunity: the credit card company should actually propose a complementary card to acquire a new customer and then send appropriate offers.

But, how to know that? Hidden Markov Models.

An HMM algorithm could tell us pretty simply that there is another signal underlying the purchases: she is buying or he is buying, a simple binary signal.

Let’s look at an example.

In R the package depmixS4 is the package to use to fit HMMs.

We create in R a signal that is actually made of two distinct signals

library(depmixS4)
library(markovchain)

signal_a <- rnorm(100,0,1)
signal_b <- rnorm(100,3,0.5)

plot(signal_a, type ="l")
plot(signal_b, type = "l")

a_and_b
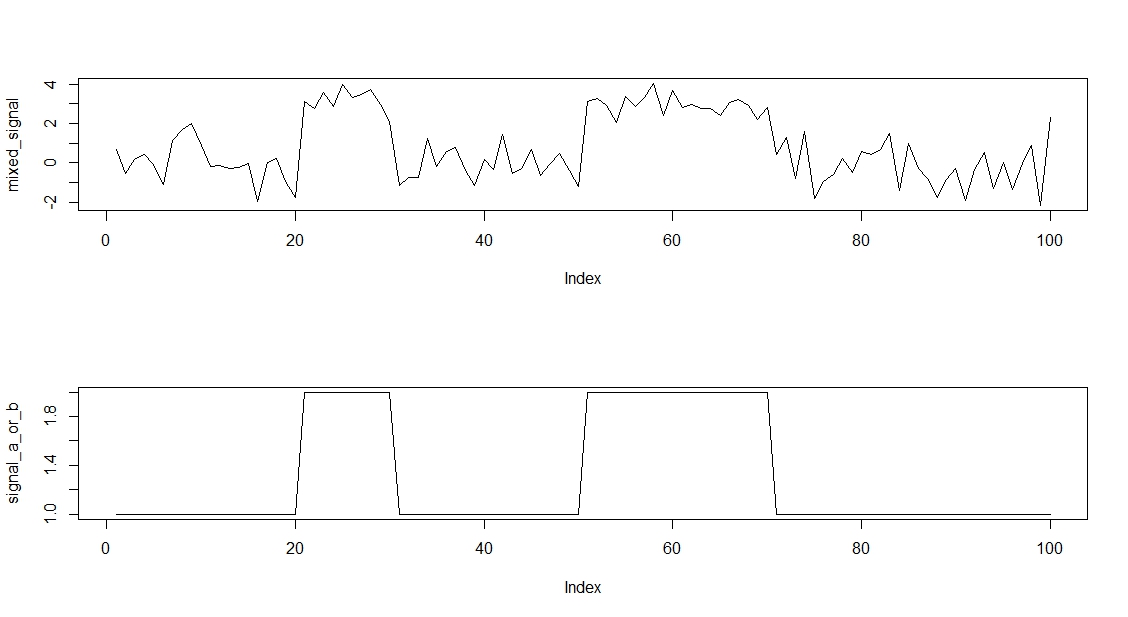
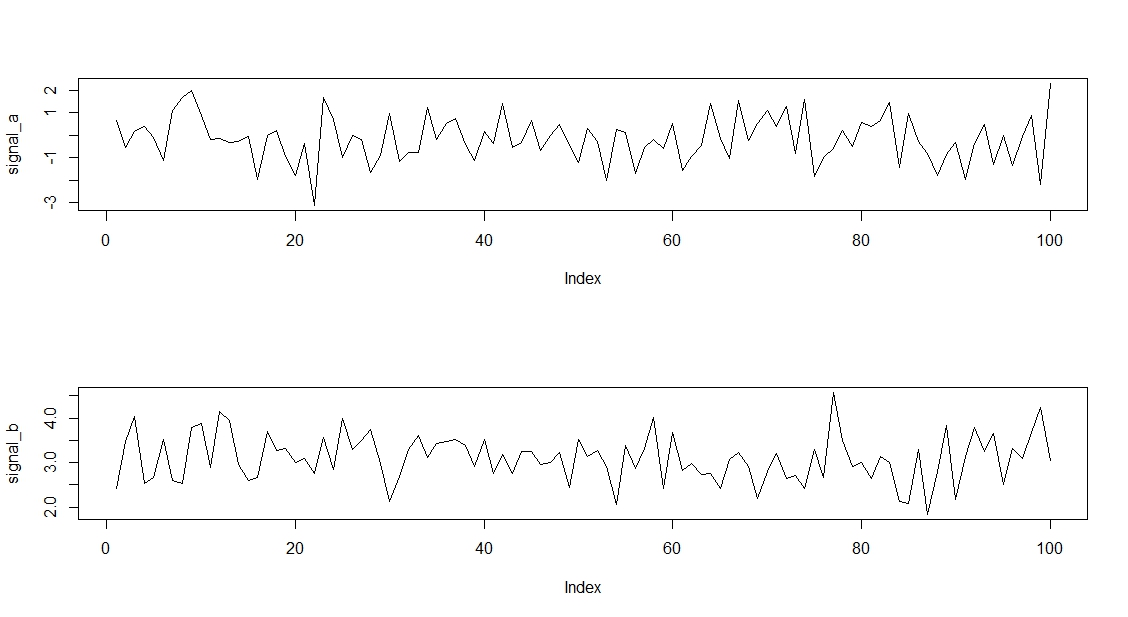
As you can see the two signals are not so different, so it won’t be an easy feat.

Let’s look at the mixed signal:

mixed_states

I also put the underlying and true mix of the two signals.

Now, let’s see how an HMM algorithm can understand that we have mixed two signals:

y <- data.frame(mixed_signal)
m1 <- depmix(mixed_signal~1, data = y,ntimes = 100, nstates = 2, family = gaussian())
fm1 <- fit(m1)
summary(fm1)
par(mfrow =c(2,1))
plot(mixed_signal, type ="l")
plot(posterior(fm1)$state, type = "l")
mixed_predicted

As you can see that is a pretty solid discovery of a hidden signal!.

Why does this matter?

Philosophically I would say that being one step closer to the truth is satisfactory in itself, but commercially, knowing underlying signals can mean Money.

How?

This will be for a future discussion, but, let me tell you this, organisations have to start pricing their information or lack of thereof.

We cannot have analytics professionals that are not able to put a money value on a model.

In the credit card example it would, perhaps, be easy.

Just answer the following questions:

  1. What is the additional spend that we could forecast having two customers with distinct cards?
  2. What is the additional revenue of being able to have two clear signals for the card linked marketing department?

This is fun and it is money.

Analytics as a (micro)service

micro-service-architecture

What is a microservice? and why analytics can take the form of a microservice?

Ok. Just to be brief, a microservice is a service that it is highly independent and focus on doing mainly one task. For example, you want a software that does sales forecasts; you could go to a vendor and get a complex and expensive software that does all sorts of stuff on time series data… but you really just need a plain sales forecast every now and then.

You can then have someone in your team that writes some code that does the sales forecast. This team member will be someone you rely on to perform the analysis, but you could also ask him/her to package the code and make it available to you to use whenever you need. This packaged code, that can be used by a “non-coder” to perform an analytical task is what I would define an “analytics microservice”.

Now, the question is:” Why a microservice?, why not buying an analytics box?”.

To answer this I need to digress slightly and discuss what a competitive advantage is in this context. I believe a competitive advantage can be of two kinds:

  1. You do something your competitors don’t do
  2. You do something better than your competitors

The marketing of analytics solutions is still, largely, about making the case for analytics as something a company should invest into… well that’s pretty basic.

What about using the wealth of knowledge at the cross-over of computer science and statistics better than your competitors?

That’s where I think microservices can be of use. You can write and update your microservice as soon as something new comes up, before any vendor has gone through the product innovation cycle. I mean, we have seen softwares like SPSS introduce data analytics techniques decades after were used by academics.

It didn’t use to be so important to have updated data analytics tools, but now days, can be.

Think about a bank, that might be using customer transactions data to forecast the start of an economic downturn (e.g. the bank could see lower spend on electronics and travel, late repayments on credit cards etc etc). This could help the bank choose the right balance of liquidity and reserves, possibly working slowly toward increased reserves when the market is slowing down in a non-dramatic fashion (suddenly stopping credits it’s a bad thing). Now, if the analytics model the bank is using is inefficient there is a higher chance of false positives and therefore the bank might increase reserves when unnecessary,… paying the opportunity cost of not lending. The bank with the better model is both less exposed to risk and also paying the right price for being less exposed.

The above is just an example (not very realistic since banks balance sheets are not managed in this way), where the bank could invest resources in creating a highly specialised and cutting edge microservice simply to predict crisis rather than buying a software that uses 10-30 years old algorithms and do all sort of things that aren’t needed.

It then could happen that you find yourself with a collection of disparate microservices that don’t talk to each other. Well, in the specific case of analytics solutions I believe this is not a huge obstacle since they all do speak the same language ultimately…maths; in a way or the other. Possibly stick to a selection of coding languages that don’t differ greatly and it shouldn’t be easy to join up all the microservices.

Next time I’ll write a blog I’d like to show an example using Python and Spark. I will time how long it takes to me to write a microservice that can be of real use.

Bye for now.


Loyalty marketing: Skinner or Led Zeppelin?

This is the first entry in my blog that it is basically 99% opinions and almost no facts. It does not intend to be anything else than a point of view. I am also aware that I am not the first one to express similar opinions.

To my experience a lot of data in marketing is collected and used with the purpose of increasing retention and profitability of existing customers rather than improving processes around acquisition.

There aren’t universally accepted definitions, but it is commonly accepted that the discipline of using data in the best commercially viable way to increase retention is LOYALTY MARKETING.

It is also true that some marketers and entrepreneurs find this exercise a waste of money and the ROI of loyalty initiatives is quite evasive.

In general I believe there are two types of individuals:

  • Those who believe experience tells us about the future
  • Those who don’t

This distinction is non-trivial and there is a lot of people that think, in their hearts, that each fact of life is always so new that past experience are practically useless, better go with intuition with gut feelings. Nevertheless it is my experience (no irony here) that those individuals always approach different problems in the same way. If you have a marketer or someone at board level with this inclination, loyalty marketing and anything data driven will be difficult to implement.

The second category loves to use previous data and information to see the future in an almost magical fashion.

The data lovers will then resort to an arsenal of techniques and, going back to the main theme, will shape loyalty marketing quite like the famous behavioural psychologist B.S. Skinner conditioned the subjects of his experiments:

Reward a certain behaviour and that behaviour will, in the long run, become hard coded in the subject.

Loyalty marketers are slightly more sophisticated and permissive and seem to work like:

Find what the customer need from the brand and push the lever all the way up rewarding any interaction that satisfies the customer need.

This usually involves some research to find out which customers are actually in need of the service and product the brand provide over a long period of time and what rewards they would really appreciate. After that though, it’s Skinner all the way. The relationship dies there and an “exchange of this for that” keeps happening (buy 10 coffees and I give you one free).

This is boring, and while I am not saying at all that the work of Skinner is boring (he made a duck play foot ball!), this static way of doing marketing is definitely boring.

Unfortunately there are at least two human reasons why it is diffused:

  • The data lovers love to find the needs and rewards and apply this mechanical method. It seem to make sense.
  • The “gut feeling” tribe see this as pretty unsatisfactory, but also something they can understand and they might think the masses will buy into it, in other words this is a trick for the morons, the “gut feeling” individual is superior to this. But, let’s do this while the next spell of genius comes (after all everyone is doing it).

And then we have Led Zeppelin. I don’t hide the fact that I am a huge Led Zeppelin fan, but this is beside the point.The point is that Led Zeppelin have incredibly loyal fans and yet they have not given them more of the same throughout their career and that’s, to my opinion, why most Led Zeppelin fans love Bonzo, Jones, Page and Plant as much as the music they created.

I am also fond of data analytics, yet I don’t find experience (that song sold so much, let’s do another one similar) as the uniquely defining aspect of analysis; a lot of it depends on the overall strategy that precedes the analysis itself.

I believe that transactional data doesn’t need to become a prison and we are far from a world where creativity can be automated.

In loyalty marketing we miss a bit of Zeppelin attitude. I just dispose of the “gut feeling” people as a bunch of lucky individuals who are at a loss when trying to grasp complexity but arrogant enough to think they don’t need to.

To all the data lovers though, I would say: take more risks and allow for an element of surprise. Reward the right behaviour but also show your customers that this is not the end, that there is an evolving relationship.

Might be true that that Hotel is the best for me and I will go back there since I get discounts anytime I go but, my desire for novity will ultimately prevail unless, like with the Zep, the element of surprise is part of the deal.

How to use data to surprise customers?

This would be another long chain of thoughts but, it might be the case that the whole process should be a function of the brand identity. The core of the identity.


The segmentation techniques jungle

apples-and-pears-ffp

There are various tools the data scientist need to master:

  1. Generalized linear models
  2. Hypothesis testing
  3. Principal component and factor analysis
  4. Market basket analysis
  5. Choice modelling
  6. Optimisation (finding extremes and particular points in curves)
  7. Time series analysis

and

SEGMENTATION

Now, in terms of segmentations there are more ways to do a segmentations than to combine coffee and milk. A few very popular methods are:

  1. K-means with the various distances
  2. Hierarchical clustering
  3. Bi-clustering
  4. Plain crosstabs
  5. Bayesian classifiers
  6. Two steps K-means
  7. Latent class analysis

and more…

In particular I believe there is a way to find segments that it is underestimated: Latent class regression.

In particular this methodology can find clusters on the basis of, for example, a particular customer spend over time.

You cold, in principle, find a cluster of people that increase spend over, say, a hundred days steadily, another group that increases very steeply and a group that seems to behave the same over the time observed etc etc…

Below there’s some code in R to explain what I am talking about

#Playing around with flexmix
library(flexmix)
## Loading required package: lattice
#Simulating the data

interval <- 1:100 #Transactions over a 100 weeks
group_a <- rep(50 + rnorm(100,0,2),100) #spending the same
group_b <- rep(100 + 0.05*interval + rnorm(100,0,5),100) #spending more
group_c <- rep(150 -0.05*interval+ rnorm(100,0,5),100) #spending less
id <- list()
for(n in 1:300) {id[[n]] <- rep(n,100)}
id <- unlist(id)
data.df <- data.frame(date =rep(interval,100), amount_spent = c(group_a, group_b, group_c),id = id)

#Flexmix working its magic

model_1 <- flexmix(amount_spent ~ date | id, data = data.df, k=3)
model_1
## Call:
## flexmix(formula = amount_spent ~ date | id, data = data.df, 
##     k = 3)
## 
## Cluster sizes:
##     1     2     3 
## 10000 10000 10000 
## 
## convergence after 4 iterations
#The algorithm rightly identified three transactional trajectories
parameters(model_1, component =1)
##                        Comp.1
## coef.(Intercept) 100.99432992
## coef.date          0.03633786
## sigma              4.63147132
parameters(model_1, component =2)
##                        Comp.2
## coef.(Intercept) 149.86774002
## coef.date         -0.03905822
## sigma              4.91297606
parameters(model_1, component =3)
##                        Comp.3
## coef.(Intercept) 49.804688685
## coef.date         0.005226355
## sigma             1.916632596
#The parameters also are rightly estimated

# flexmix did the job apparently but let's check the groups compositions
# Component 1 should give us IDs between 100 and 200 etc...
data.df$cluster <- model_1@cluster
unique(data.df$id[data.df$cluster == 1])
##   [1] 101 102 103 104 105 106 107 108 109 110 111 112 113 114 115 116 117
##  [18] 118 119 120 121 122 123 124 125 126 127 128 129 130 131 132 133 134
##  [35] 135 136 137 138 139 140 141 142 143 144 145 146 147 148 149 150 151
##  [52] 152 153 154 155 156 157 158 159 160 161 162 163 164 165 166 167 168
##  [69] 169 170 171 172 173 174 175 176 177 178 179 180 181 182 183 184 185
##  [86] 186 187 188 189 190 191 192 193 194 195 196 197 198 199 200

The example above it’s just an illustration but, this methodology can be used in various way, e.g. in insurance to distinguish between claimants populations and detect fraudsters.

Like most analytics methodologies the applications depend on the user imagination.

I believe with segmentation technique there is a real danger of data scientists avoiding the use of various methods for the sake of simplicity.

On the other hand, to really take commercial advantage of segmentation techniques, there aren’t many shortcuts. Hard work and creativity are the only way to gain an advantage from competitors.

In short my advice is: be adventurous anytime but test how robust the segmentation is, quite to the detail.

Predictive analytics – Can we really predict?

Snip20150920_3

In all industries, as much as in life, we’d like to predict what’s coming (we still want to be positively surprised though).

Now, it is rumoured that there is a £5 Billion industry that thrives on the need businesses have to see the future. What forecaster use to look into the future is often labelled: predictive analytics.

The concept is quite easy to grasp: collect data and then create a model that tells you what’s coming given the data. For example, in one of the many ways, we could write this concively:

P(Data in two weeks|Data in the past six months)

What is the probability that things will be developing in a certain way given that they have been developing in a particular way in the last six months?

Since I mentioned “probability” most people, correctly, suppose that the tool to use to do predictive analytics is statistics. That is correct, but, the question is:

Do we have a formulation of statistics useful for forecasting?

I will answer the above question later. For now let’s look at an example of the intricacies behind statistical inference, i.e. inferring from data using statistics.

We do know that 90% of women with breast cancer will show a positive mammography. That is, if we know the end of the story, our tools tell us that we could have seen it, or so it seems.

We can represent this has P(mammography +|breast cancer) = 0.9

Now, what we would like to have is the probability that a woman has breast cancer once the mammography is positive. We can do that looking at some statistical data and using Bayes formula:

P(breast cancer|mammography +) = P(mammography +|breast cancer)*P(brest cancer)/P(mammography+)

What is this amazing predictive power?: 3.6%.

That is, only 3.6% of women showing a positive mammography actually have a breast cancer. (randomized trials are not the solution to every statistical evil).

This is not even “predicting”, yet we see that our tools are somewhat inappropriate.

In this case we could obtain a P(theory|data), the probability of theory being true given the data, while, many times, we need be content with P(data|theory) and the null hypothesis test that so many people fail to understand, I would say, understendably.

Now, going back to prediction we can see that what predictive analytics asks of the already shacky building of statistical inference is to introduce some form of causality. It is famous the finding from the economist David J. Leinweber that the best predictor of the S&P 500 is … butter production in Bangladesh. That wouldn’t be good for a fund manager would it?.

Unfortunately I now answer the important question posed before:

No, we don’t have a formulation of statistics unambiguously useful for forecasting.

The reason being: we don’t know how to deal with causality. For now.

I say “for now” since there are several attempts that do make sense and can be understood by mathematicians but are really difficult to implement, generally, in a business environment.

What data scientists will have to do is to make predictive statistics accessible.

Snip20150920_1

Above is an illustrative picture from a package called CAUSAL IMPACT that can be used in R. The package tries to identifiy the causal impact of an “intervention”. I recommend everyone to play with it.

I would also recommend anyone to read more about Granger causality and potential response models. This is just a starting point but the issue is still problematic. After all whoever studied physics knows that causality is… an illusion.

Correlation coefficient… Easy isn’t it?

Featured image

There is one coefficient in statistic that is used and misused by more than any other:

THE CORRELATION COEFFICIENT

Generally speaking you might be doing some market research and you come across two variables and you want to see how they are related. How to do that in its simplest form?.

Easy let’s use the correlation coefficient. Then, usually, practice goes that if the correlation coefficient is greater than 0.6 we believe there is a relationship worth further investigation, and/or actions.

There are things to bear in mind when talking correlations though, and in particular that:

The coefficient of correlation only detects linear dependence. 

It is important to consider the variables that we have at hand and judge if we generally think that if a relationship exists, that has to be linear.

In several cases this won’t work but with a bit of thinking before just using a line of code things can make more sense.

For example let’s suppose we are pondering an investment into a retail outlet and we want to see if there’s enough population, and not enough competition, in the area to sustain the business. Let’s imagine it is not a simple coffee shop but a rather less common service like, for example, a guitar shop. Now it is the case that we did some research in a similar area and check how many individuals go to a certain guitar shop depending on the distance. After calculating the correlation we don’t see a strong relationship therefore one of the investors seems to push for it on the assumption that it will be possible to attract customers from far away given the nature of the business… distance won’t matter too much.

Or so it seems, but after applying a simple transformation, for example taking the inverse power of the distance we see that the correlation is much higher… How to interpret this?

Well, the solution is simple. The simple distance is linear but the drop in individuals going to the shop is much higher moving from 2 to 4 miles as compared to the drop moving from 1 to 2 miles. This is usually a fact of life and not just for gravity.

In this case it would be easy to spot the transformation that makes it clear to us that the correlation is strong, but what if we are in the presence of more exotic parameters?

One of the options is to normalize the variables to correlate through the Box-Cox transformations. In this way we have the variables being both normal and to some extent linearized. I strongly recommend variables are linearized before trying out correlations that have a strategic weight.

Luckily for us R has a package with the right instruction:

The library is car, and the function to use is powerTransform.

Now I advice you don’t go checking all the correlations that influenced your research decisions in the past using this transformation, you might just find out you were wrong.

Google glasses, market research and professional sharing.

sharing_suitprofessional_sharing

Last year I travelled some parts of Japan and I came across an exhibition that showed the work of Yosuke Ushigome, a Japanese artist based in the UK. The tilte of his work was: PROFESSIONAL SHARING.

The work consisted of a suit with some gadgets and a video that showed the uses of the suit. Most of the application were around the common subject of the sharing economy. The suit wearer would meet someone to charge its phone, would share pictures and information on things happening across Tokyo, would share his time queueing in place of someone else or share his health information while engaging on a particular activity for a customer.

The suit allowed the professional sharer to do his/her job and get paid right away.

Now, it is quite easy then to move a step closer to market research and imagine a world where, along with interviewers, analysts, moderators and so forth, we also have professional sharers:

Individuals using all sorts of wearable devices to share any information that could be of use.

One question that came to me was: “What if Google was actually trying to do something like this with its Google Glasses?”.

Most professional in the field of market research know that millions of people work for Google without even knowing it and Google Glasses would have been an amazing weapon in the arsenal of the search engine giant.

The experiment failed though…

Nevertheless the principle and the figure of the professional sharer will eventually join the market place to my opinion, and that’s where I start to dream.

I can only begin to imagine the numerous application of such a market research resource applied to insurance, health, but also public security, journalism and more.

This will give us much more data that could be free of the various limits of survey data yet being somewhat more “deep’ than the already milked transactional data.

It will then, possibly, become even more important for market researchers to establish meaningful correlations and relations between a range of data structures of all sorts.

First post

Hi All,

With this first post I’d like to introduce myself and tell you what I will cover.

Having studied theoretical physics and statistics my inclination toward quantitative research and analytics is very pronounced.

Wit this blog I’d like to share my views on:

  1. Statistical methods
  2. Analytics and the R statistical language
  3. Data science and AI

I don’t really suppose that my posts will be very original or super useful to anyone in general but I believe that the more information is shared the better, so I hope that some line of code, some example, or consideration will be useful.

Best

Henry