
Most of us, especially in business, but also in our private lives, peform some basic mathematical modelling all the time. We can do it wrong or we can do it right, but we do it … constantly.
The most basic form of mathematical/statistical modelling is to give shapes to our uncertainty (ignoring the shape is also part of it).
Let me tell you a story that should clarify what I mean.
John and his team at SalesX, an online marketplace, are trying to outsource their call centre operations and are looking for potential suppliers. They sent out an RFP (request for proposals) and they received a few responses. (note: despite the name SalesX is not owned by Elon Musk).
John calls his team in his office:
John: “Hi, everyone, could you give me a clear high level summary of the various responses we received from the call centers?”
Jane: “Yes, we shortlisted 3 responses for you, although we are quite confident on a winner…”
John: “Ok, what are the average call handling times of the shortlisted suppliers?”
Jane: “They are all about 2 minutes, but one provider is considerably cheaper. It is quite clear we should go for them. SmartCalls is the name of the company and they are heavily relying on automation and AI to support their operations, which keeps their costs very low, a very clever team.”
John: “Ok, sounds pretty good, let’s meet them but still keep another response in the race as we dig deeper beyond performance and price.”
Laura in Jane’s team, is not convinced by such a swift decision, and questions Jane…
Laura: “Jane, 2 minutes is great but what about the % of calls that are not resolved in one session? that one is…”
Jane: ” Yes that number is higher for SmartCalls, but this is hard to compare across providers right? as their clients have different rules for re-routing inquiries in house…”
Laura: “John, Jane, before moving forward with SmartCalls, let me reach out to the shortlisted suppliers with requesting some additional information. It will be very hard to switch to another supplier once we are done with this…”
John: “Ok but I give you 3 days, I hope you are after something substantial… SmartCalls is super cheap. Handling calls is not rocket science…”
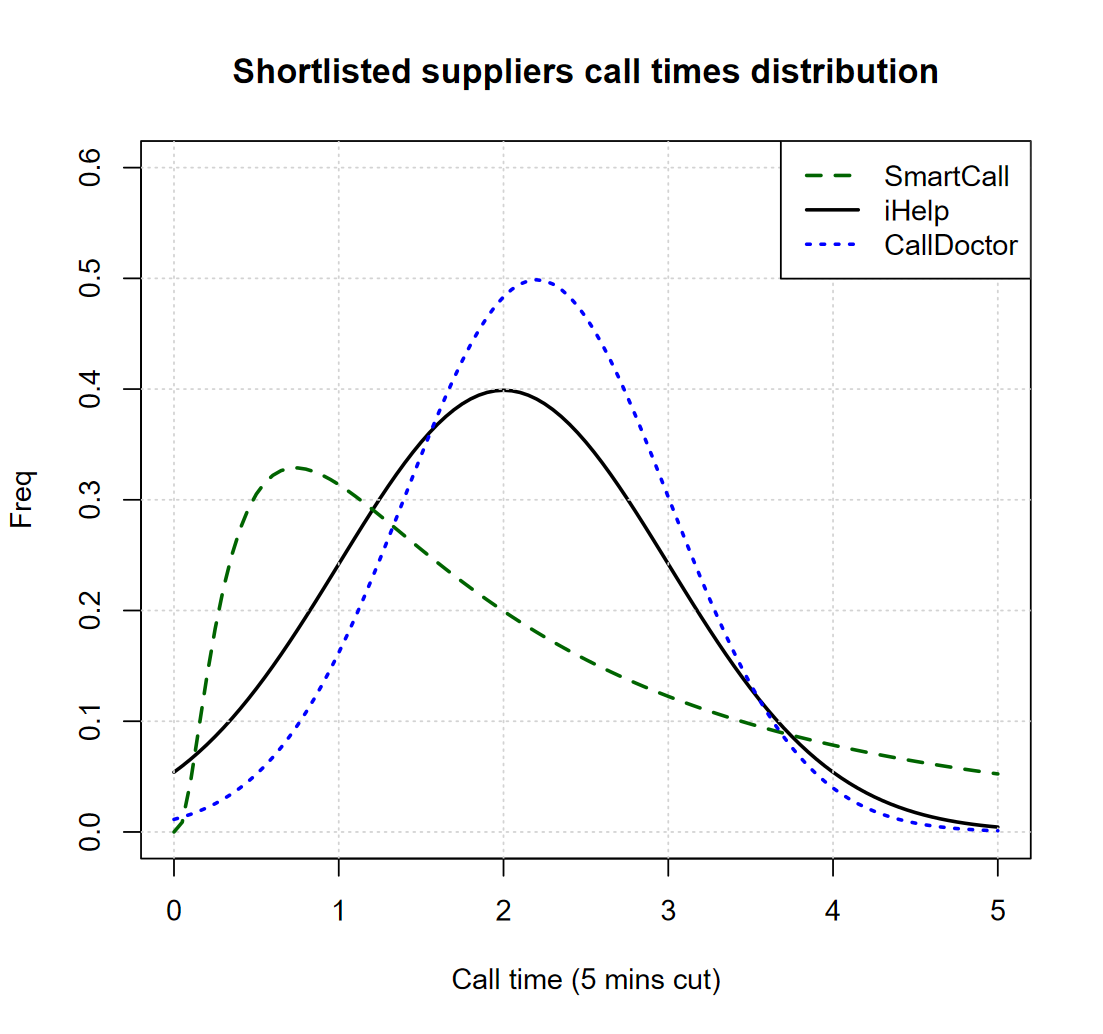
Laura goes back to the suppliers and asks them for a full view of the distribution of call handling times and she finds out the following, summarized in below chart, which she promptly shares with John:
John looks at it but he is not the too clear on what that means…
John: “Ok Laura, translate please…”
Laura: “Basically SmartCall business model is that of leveraging AI with an inexperienced and cheap workforce, they can deal quickly with a large number of calls relating to simple issues, but their operators lack the creativity or experience to deal with issues of medium complexity. The operators all work remotely with no chance of sharing information with each other…”
John: “Wait, wait… the chart first, what does that mean?”
Laura: “Oh… isn’t that obvious. SmartCall has a 2 minutes call average, yes, but this is driven by a larger number of very quick calls, when it comes customer satisfaction there’s a good number of calls that go beyond 3-4 minutes.”
John: “Ok I get it, their calls are either quick, or rather long whilst, iHelp for example, is able to be more consistent, with most calls handled in about 2 minutes right?”
Laura: “Yes, they avoid shortcutting the initial problem identification phase and have a longer list of mandatory screening questions, but this pays off. They are able to share the calls with specialized teams and…”
John: “Ok I get it indeed. I also see several of SmartCall going beyond 5 minutes, which is our threshold for bringing back customer calls in house… good work Laura. Jane, good work on hiring Laura”
Jane is a bit deflated, but she ultimately smiles as she is proud of having trained Laura well.
The quick story above is a good example of how we routinely perform unsophisticated statistical modeling, especially when we implicity anchor ourselves to some one dimensional metrics, like averages.
When John heard the average call times he implicitly assumed that those averages were comparable and meaningful in their own right. This means he assumed (modelled) the call times range and frequency to be similar in shape across suppliers, which is a fair bit of statistical modelling in practice (wrong modelling in this case).
After all, what can you really tell from comparing averages unless you make the rather strong assumption that those averages are informative in summarizing the underlying data apprpriately? If you do so, although you might not know it, you are doing statistical modelling.
Laura, instead, decided to look at the actual shape of the data and to avoid any high level, uninformed assumption, yet she is still assuming quite a few things, among which:
- The data she received is representative (not skewed toward some specific types of calls)
- The distribution of the data will be consistent over time
- The distribution of the data basis how call centers are handling other clients calls is relevant to SalesX customer base
That’s basically statistical inference, and whenever you make a decision or judge data, although you might not think about it, you, as well, are doing statistics and data science.
The question is: “Do you know when you are doing that well, or when you are being ineffective?”
Another key aspect of giving shapes to uncertainty is the key question of what metrics to measure, whether average call times or abandon rate, or both, or other metrics. Which ones to chose?
This is somewhat the operational solution of the problem I presented above, when it comes to data that tracks a business activity or process, which are the metrics that truthfully summarize the shape of that data?
I can recommend two good books on this topic, one is a technical text, Optimal Control Theory by Donald E. Kirk, the other is a more accessible read focusing specifically designing meaningful metrics that track Objective Key Results (OKRs), Measure What Matters by John Doerr
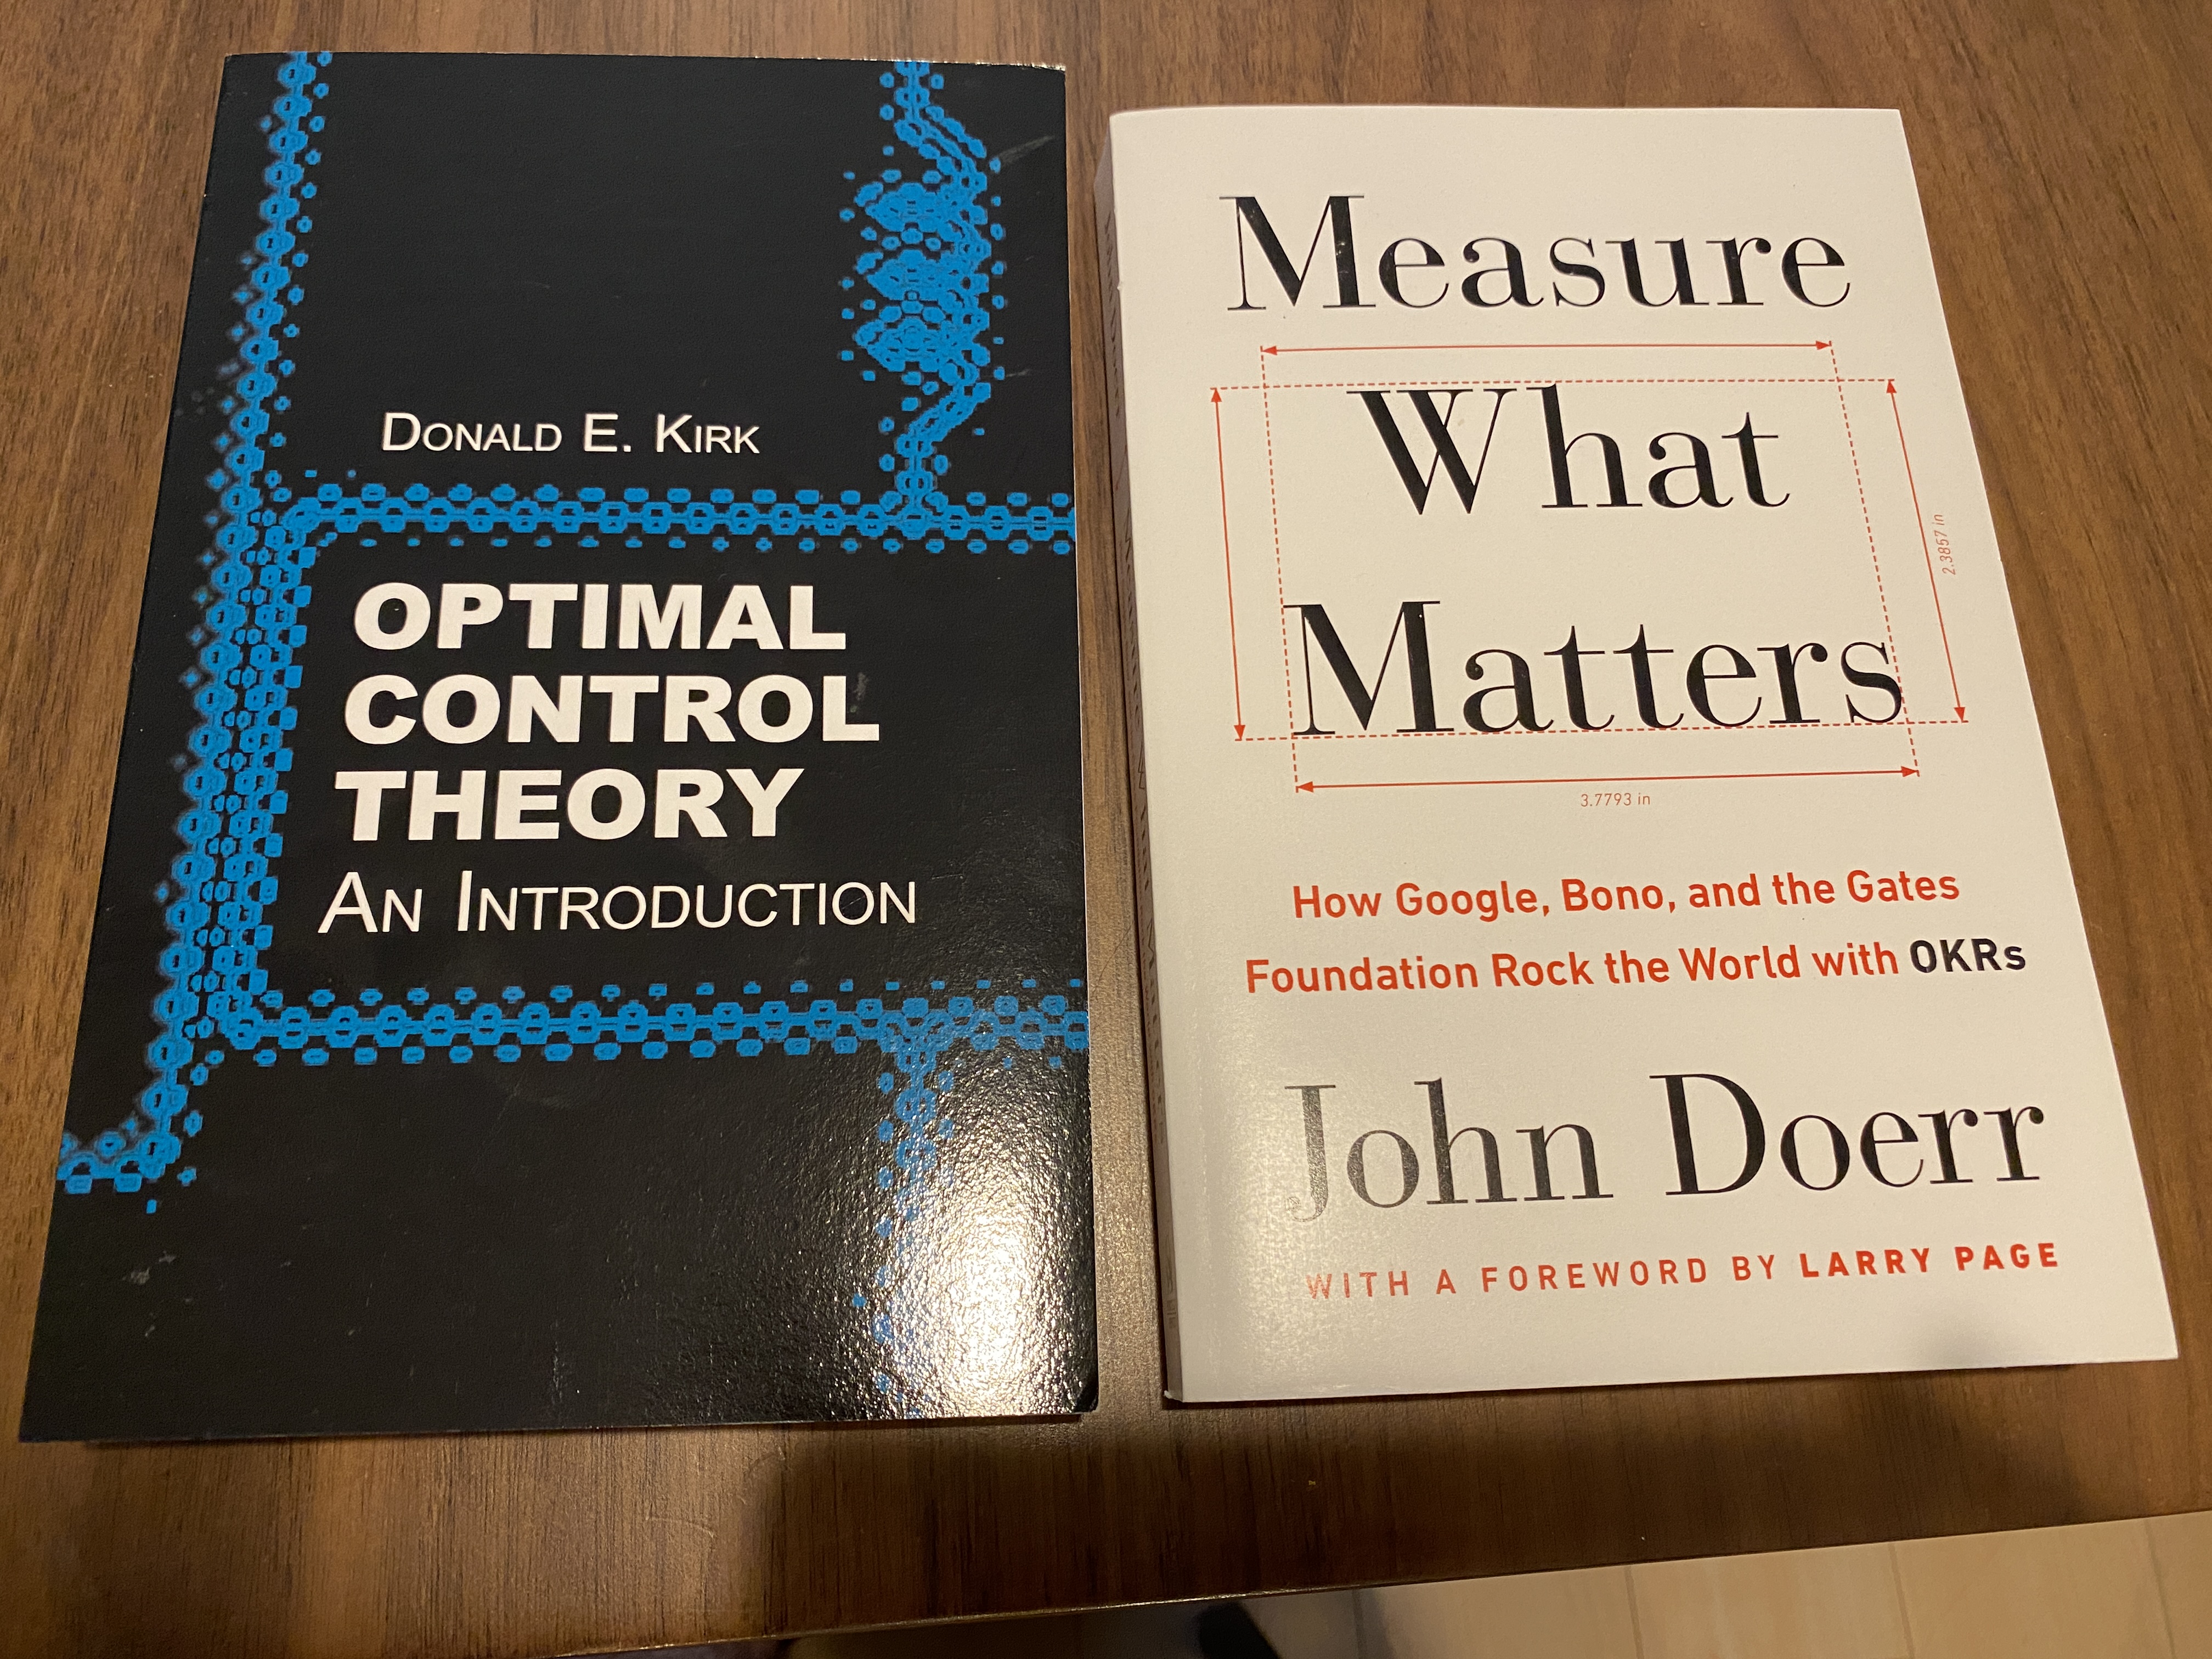
Optimal Control Theory goes well beyond the subject of performance measures, but the first 50 pages are a good introduction to the overall framework.
