Since the days of the big data related buzz words, now over 20 years ago, data driven changes to business models, product values, customer journeys and more have gone through massive enhancements.
Nevertheless in the early days there were several discussions about the supposed “value” of data and such transformations. I know it because I was there, in most cases on the selling side.
It was not uncommon to find middle managers considering data driven transformations as a “nice to have” or simple ways to copy the competition, or something to do from a PR perspective. It was also not unusual for large businesses to look down on new tech startups as if looking at kids playing with unnecessary & fancy toys.
There was a lot of: “we do things this way because it works”, “our customers don’t need this”, “open source is dangerous”, “we do not need fancy machine learning for our simple problems” and so on.
There was also a lot of confidence in existing practices, something to the extent of: “I have been doing this for 20 years, I know better. My expertise beats your data science kid…”
To be clear a lot of the skepticism was healthy and based on more than gut feelings, but overtime the most negative voices disappeared. Nevertheless, a question still remains actual when starting any data driven & AI powered transformation: “What value will it deliver considering the unknowns and costs?”
Is it just headcount reduction? Or reduced wastes? Or better products? How will we measure all of this?
I am not going to answer those questions in general, in my view it would be silly to do so. How technology driven innovations can benefit a given solution to a problem is very contextual, not something we can broadly generalise.
I will though share an example, and a good example I believe. An example where value is upfront and easy to measure: How much value a simple machine learning stock trading algorithm can deliver when put against a simple rule of thumb trading strategy?
Disclaimer: I am not an experienced stock trader, I have only started recently following the sharp devaluation of the Japanese Yen (I am based and work in Tokyo). Do not reach out for any investment advise.
In any case, I thought it would be interesting to quickly put the two trading strategies against one another. Both very simple and devised within few days in the small window of time I have between my kids falling asleep and my inability to keep my eyes open.
The two strategies are as follows (on a daily trading routine) and are based only on S&P 500 Stocks:
- Rule Of Thumb: Every day check S&P 500 stocks and select top 50 stocks once sorted by strength of linear growth in the past 15 days, and by how much the price has gone down in the past 3 days. Buy the 50 ones that had the strongest linear growth, but lost the most value in the last 3 days. The rationale is that the price should bounce back to regress to the mean of the linear growth
- Machine Learning: Create a model that basis 15 days of S&P 500 stock price history it gives the probability that the price will grow the next day. Buy stock proportionally to that probability, when the probability is > 50%. The model is trained with 50 random dates data from the first part of 2023.
As you can notice even the Machine Learning approach is really simple, we are feeding the model only 15 days of stock price data and creating only 3 features actually: avg 15 days growth, avg 15 days volatility and last 3 days price change (as a ratio). This is super basic, and indeed only used to compare with the basic Rule of Thumb approach. The idea is that we only want to assess the value of the Machine Learning algorithm (a simple logistic regression) and keep things as similar as possible to the basic Rule of Thumb strategy.
Here are the results! (trading from July 23 to June end 24, price/value indexed at the first day of trading):
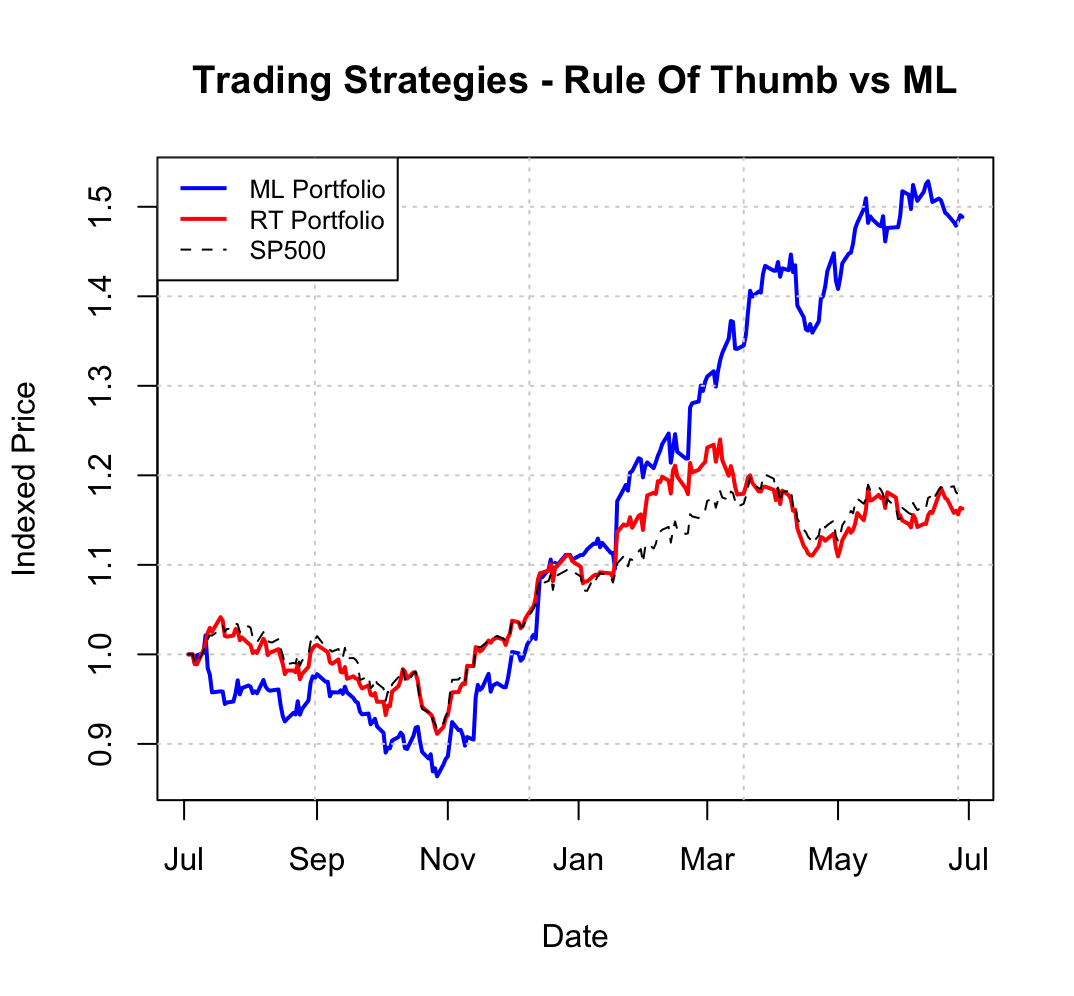
Now it does not look like a massive win, but we are looking at a return on the investment of ~50% as opposed to ~15% (S&P index gains) over a year. It is also of note that the ML model was actually doing worse when the S&P500 index overall was going low in the in the second half of 2023. The rule of thumb instead seems to basically track the S&P500 index overall.
To be honest I could have given up on the ML trading algorithm when the S&P500 index was going down actually, but overall it is interesting to see what such a simple ML model could achieve in a year.
When I showed that chart to my wife she said: “You made up this chart with your dreams I think… stick to the ETF, but keep dreaming”. I do not blame her skepticism, above chart looks to good to be true from Jan 24 onward.
In order to get more clarity and “curb my enthusiasm” I have tried the same comparative analysis in a different time when the S&P500 index was indeed quite volatile, from July 22 to June end 23 (ML model trained with 50 dates first half of 2022).
Below are the results:
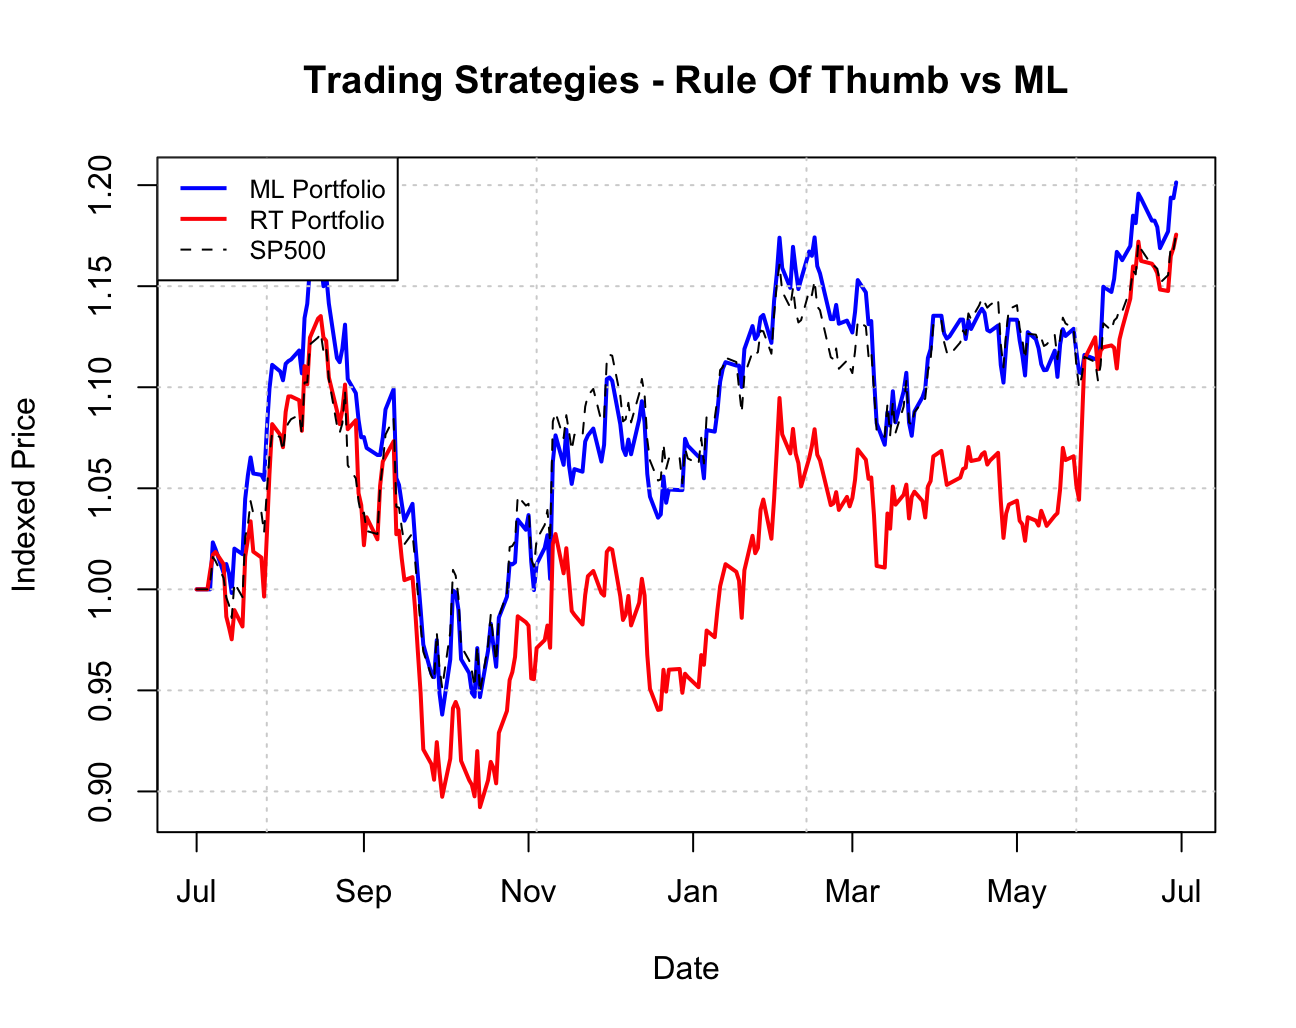
It looks like in more volatile times the Machine Learning trading algorithm tracks pretty close the S&P500 index, but we also see that the Rule of Thumb approach does not transfer well as it fails miserably.
It is also of note that over 250 trading days, the ML approach beat the S&P index 142 days and the Rule of Thumb approach 245 trading days.
In conclusion no Jim Simons level wizardry (look Jim Simons up if interested in algorithmic trading) but as for our purpose, the example shows pretty clearly what value Machine Learning can add even in a very simple setting and with highly volatile data.
What would then be possible integrating additional data sources like businesses performance, macro, searches of stock terms on the internet, Investor updates data and more?
Forecast: AI assistants will enable even further “scientization” of business practices and decision making, but we will need people able to articulate the solutions to a variety of audiences.
Note: A decent book on financial analytics below, based on R code wise, but easy to transfer to Python if needed: