
In all industries, as much as in life, we’d like to predict what’s coming (we still want to be positively surprised though).
Now, it is rumoured that there is a £5 Billion industry that thrives on the need businesses have to see the future. What forecaster use to look into the future is often labelled: predictive analytics.
The concept is quite easy to grasp: collect data and then create a model that tells you what’s coming given the data. For example, in one of the many ways, we could write this concively:
P(Data in two weeks|Data in the past six months)
What is the probability that things will be developing in a certain way given that they have been developing in a particular way in the last six months?
Since I mentioned “probability” most people, correctly, suppose that the tool to use to do predictive analytics is statistics. That is correct, but, the question is:
Do we have a formulation of statistics useful for forecasting?
I will answer the above question later. For now let’s look at an example of the intricacies behind statistical inference, i.e. inferring from data using statistics.
We do know that 90% of women with breast cancer will show a positive mammography. That is, if we know the end of the story, our tools tell us that we could have seen it, or so it seems.
We can represent this has P(mammography +|breast cancer) = 0.9
Now, what we would like to have is the probability that a woman has breast cancer once the mammography is positive. We can do that looking at some statistical data and using Bayes formula:
P(breast cancer|mammography +) = P(mammography +|breast cancer)*P(brest cancer)/P(mammography+)
What is this amazing predictive power?: 3.6%.
That is, only 3.6% of women showing a positive mammography actually have a breast cancer. (randomized trials are not the solution to every statistical evil).
This is not even “predicting”, yet we see that our tools are somewhat inappropriate.
In this case we could obtain a P(theory|data), the probability of theory being true given the data, while, many times, we need be content with P(data|theory) and the null hypothesis test that so many people fail to understand, I would say, understendably.
Now, going back to prediction we can see that what predictive analytics asks of the already shacky building of statistical inference is to introduce some form of causality. It is famous the finding from the economist David J. Leinweber that the best predictor of the S&P 500 is … butter production in Bangladesh. That wouldn’t be good for a fund manager would it?.
Unfortunately I now answer the important question posed before:
No, we don’t have a formulation of statistics unambiguously useful for forecasting.
The reason being: we don’t know how to deal with causality. For now.
I say “for now” since there are several attempts that do make sense and can be understood by mathematicians but are really difficult to implement, generally, in a business environment.
What data scientists will have to do is to make predictive statistics accessible.
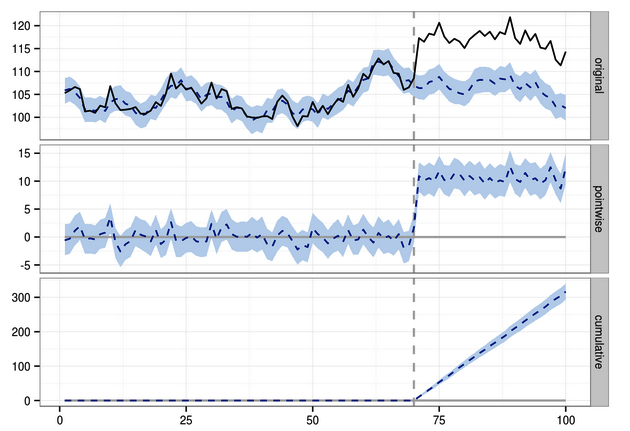
Above is an illustrative picture from a package called CAUSAL IMPACT that can be used in R. The package tries to identifiy the causal impact of an “intervention”. I recommend everyone to play with it.
I would also recommend anyone to read more about Granger causality and potential response models. This is just a starting point but the issue is still problematic. After all whoever studied physics knows that causality is… an illusion.
